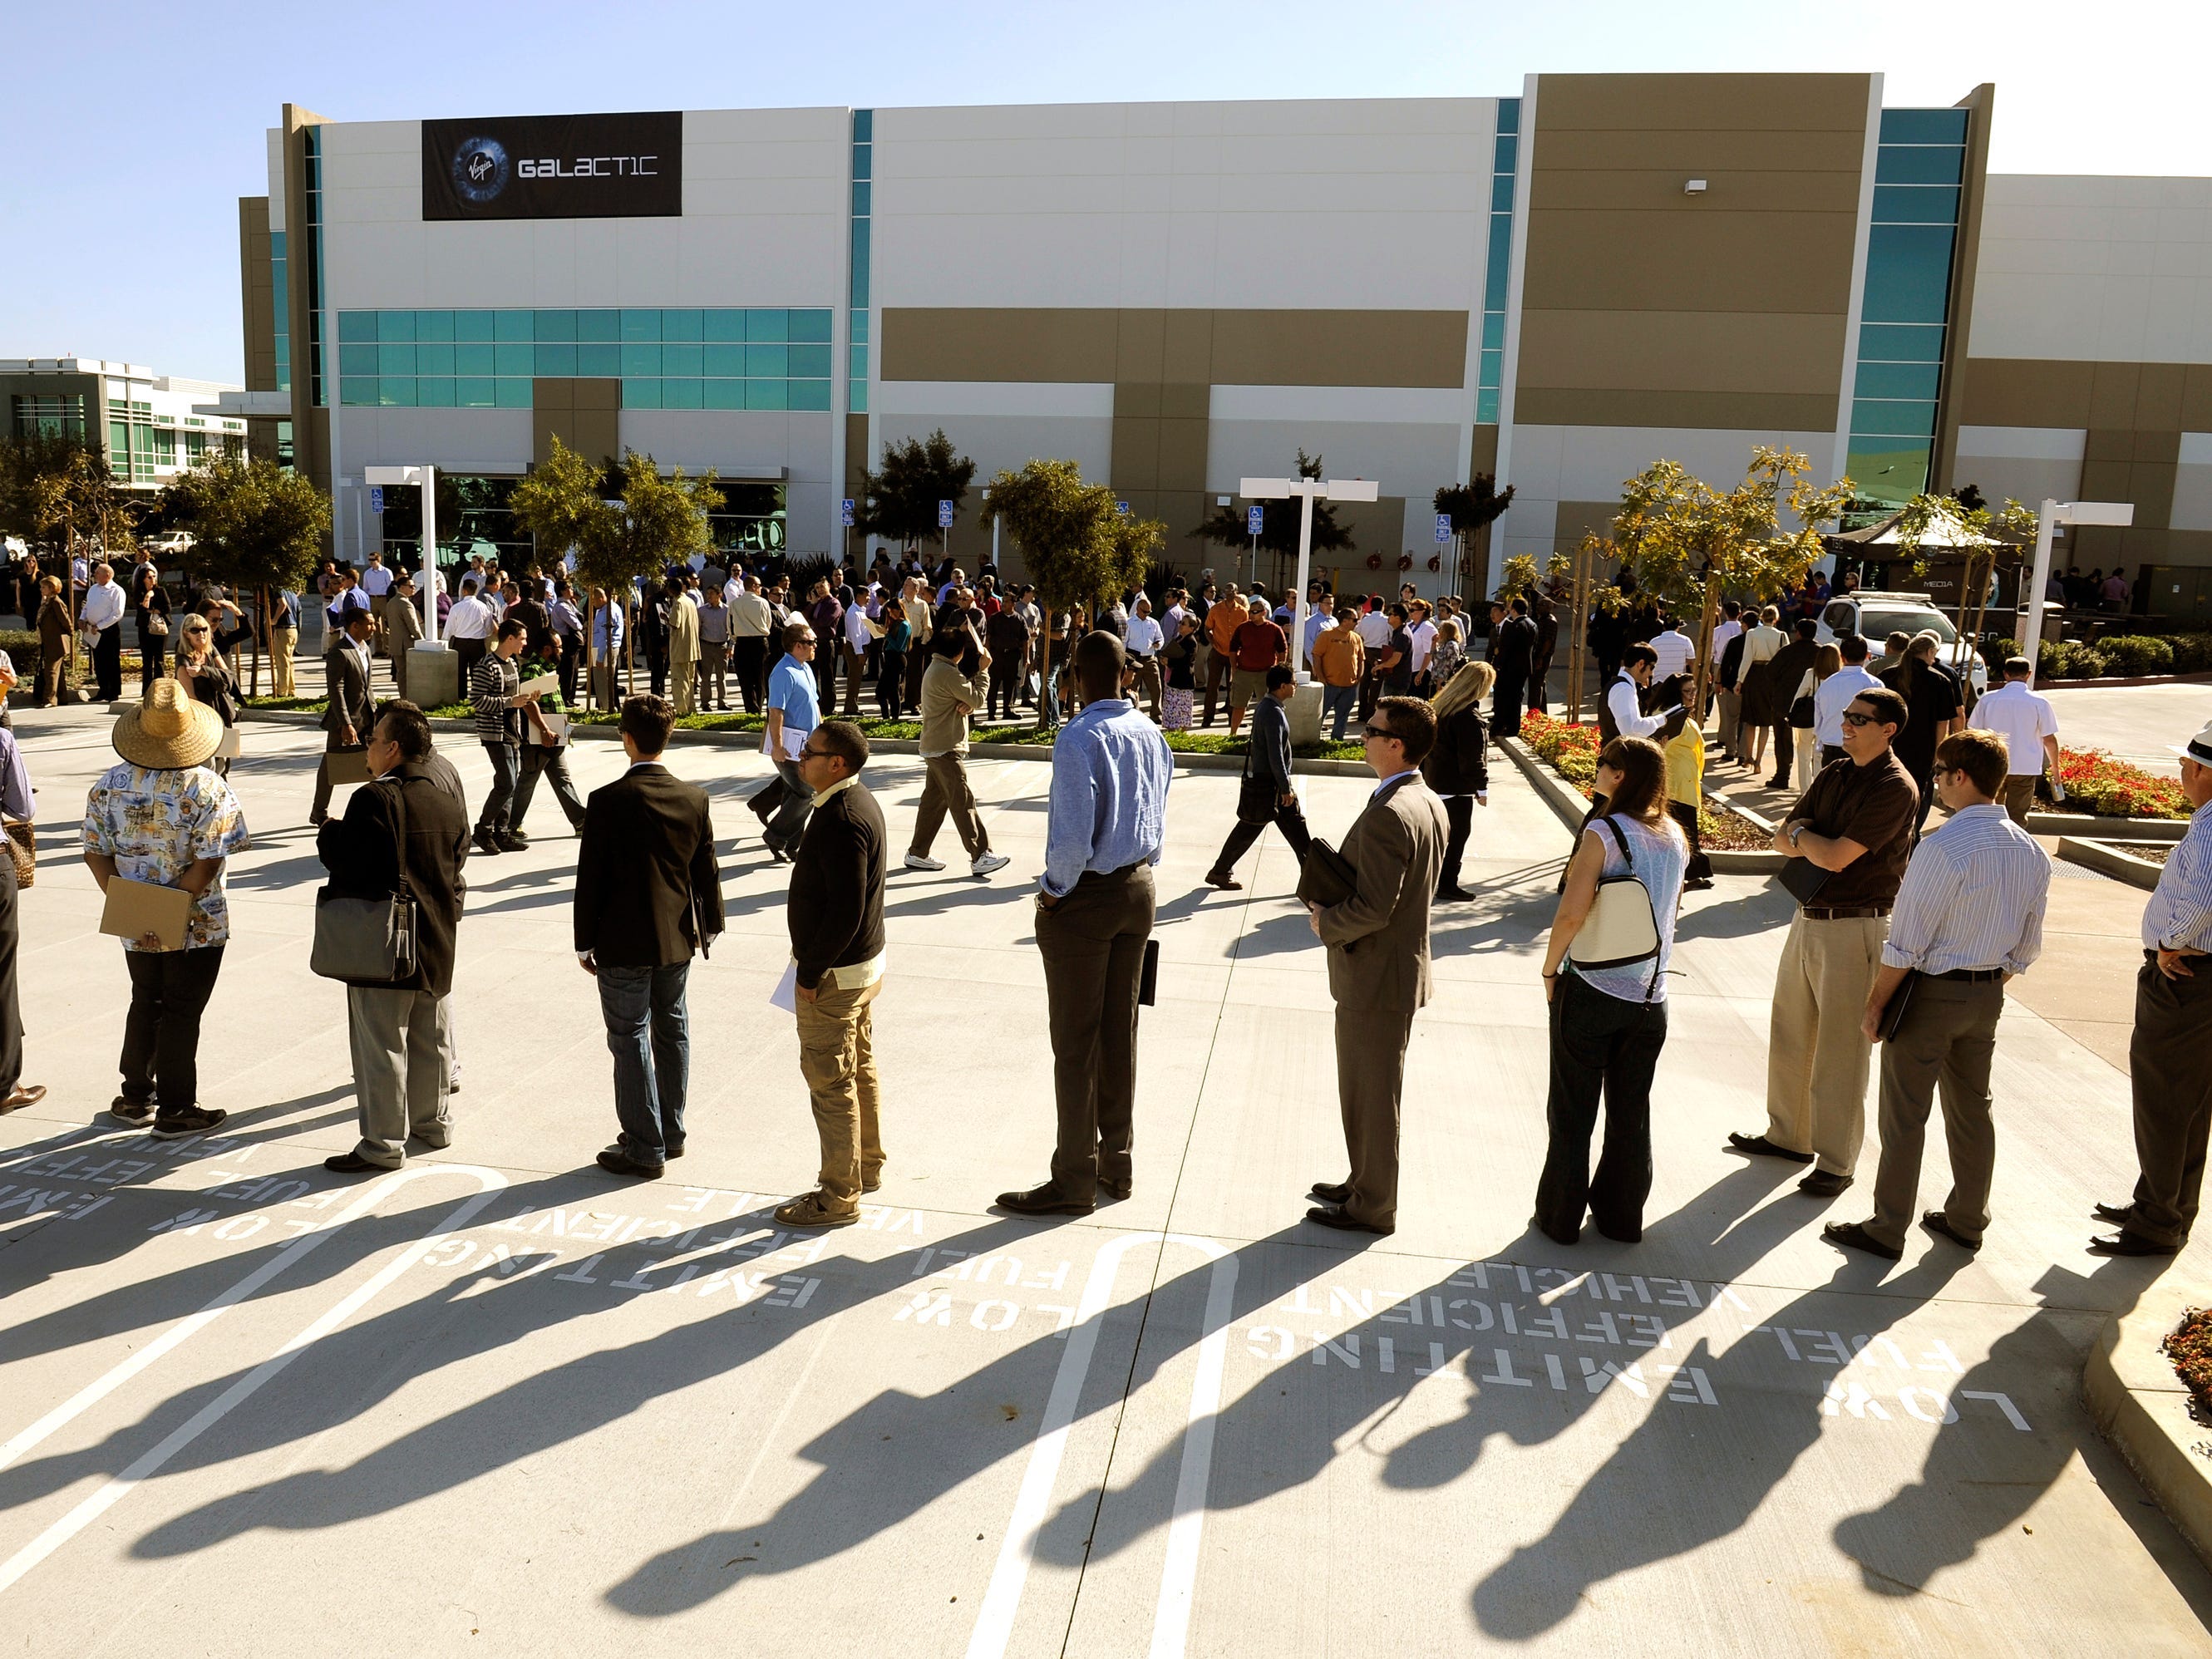
Bob Riha, Jr./Getty Images
If you feel like job opportunities are hard to come by right now, it’s not just you.
The Bureau of Labor Statistics’ latest report on job openings and labor turnover, released on Wednesday, showed that, for the first time since April 2021, there are more job seekers than job openings in the US, Reuters reported.
At 0.99 openings per unemployed person, compared to the 1.05 rate in June, it’s the first time job seekers have outnumbered openings since April 2021, when the rate was 0.96.
The bureau’s jobs report, released Friday, showed that 22,000 jobs opened up in August, short of the expected 75,000. The unemployment rate slightly increased to 4.3%.
A WalletHub study released Thursday shed light on how unemployment is hitting each of the US states and Washington, DC. Using data from the Labor Department, it ranked all 50 states and DC based on the percentage increase in unemployment claims between the week of August 18 and August 25. It also considered how the number of claims compared to those made a year ago, and calculated the number of claims per 100,000 people in the labor force.
Overall, WalletHub found that the week-over-week increase in unemployment claims in the US averaged 3.5%.
“The dynamic has shifted towards employers when it comes to hiring as employers have slowed their hiring rate significantly, but employers are reluctant to reduce headcount as they recall the challenges of hiring a few years ago,” Daraius Irani, the vice president of business and public engagement at Towson University, said in the WalletHub report.
Here are the 10 places where unemployment claims are increasing the most, per WalletHub.
10. California
Thomas Winz/Getty Images
Unemployment claims per 100,000 people in the workforce: 198
Week-over-week increase in unemployment claims: 3.56%
Increase in unemployment claims in 2025 compared to last year: 11.47%
9. New York
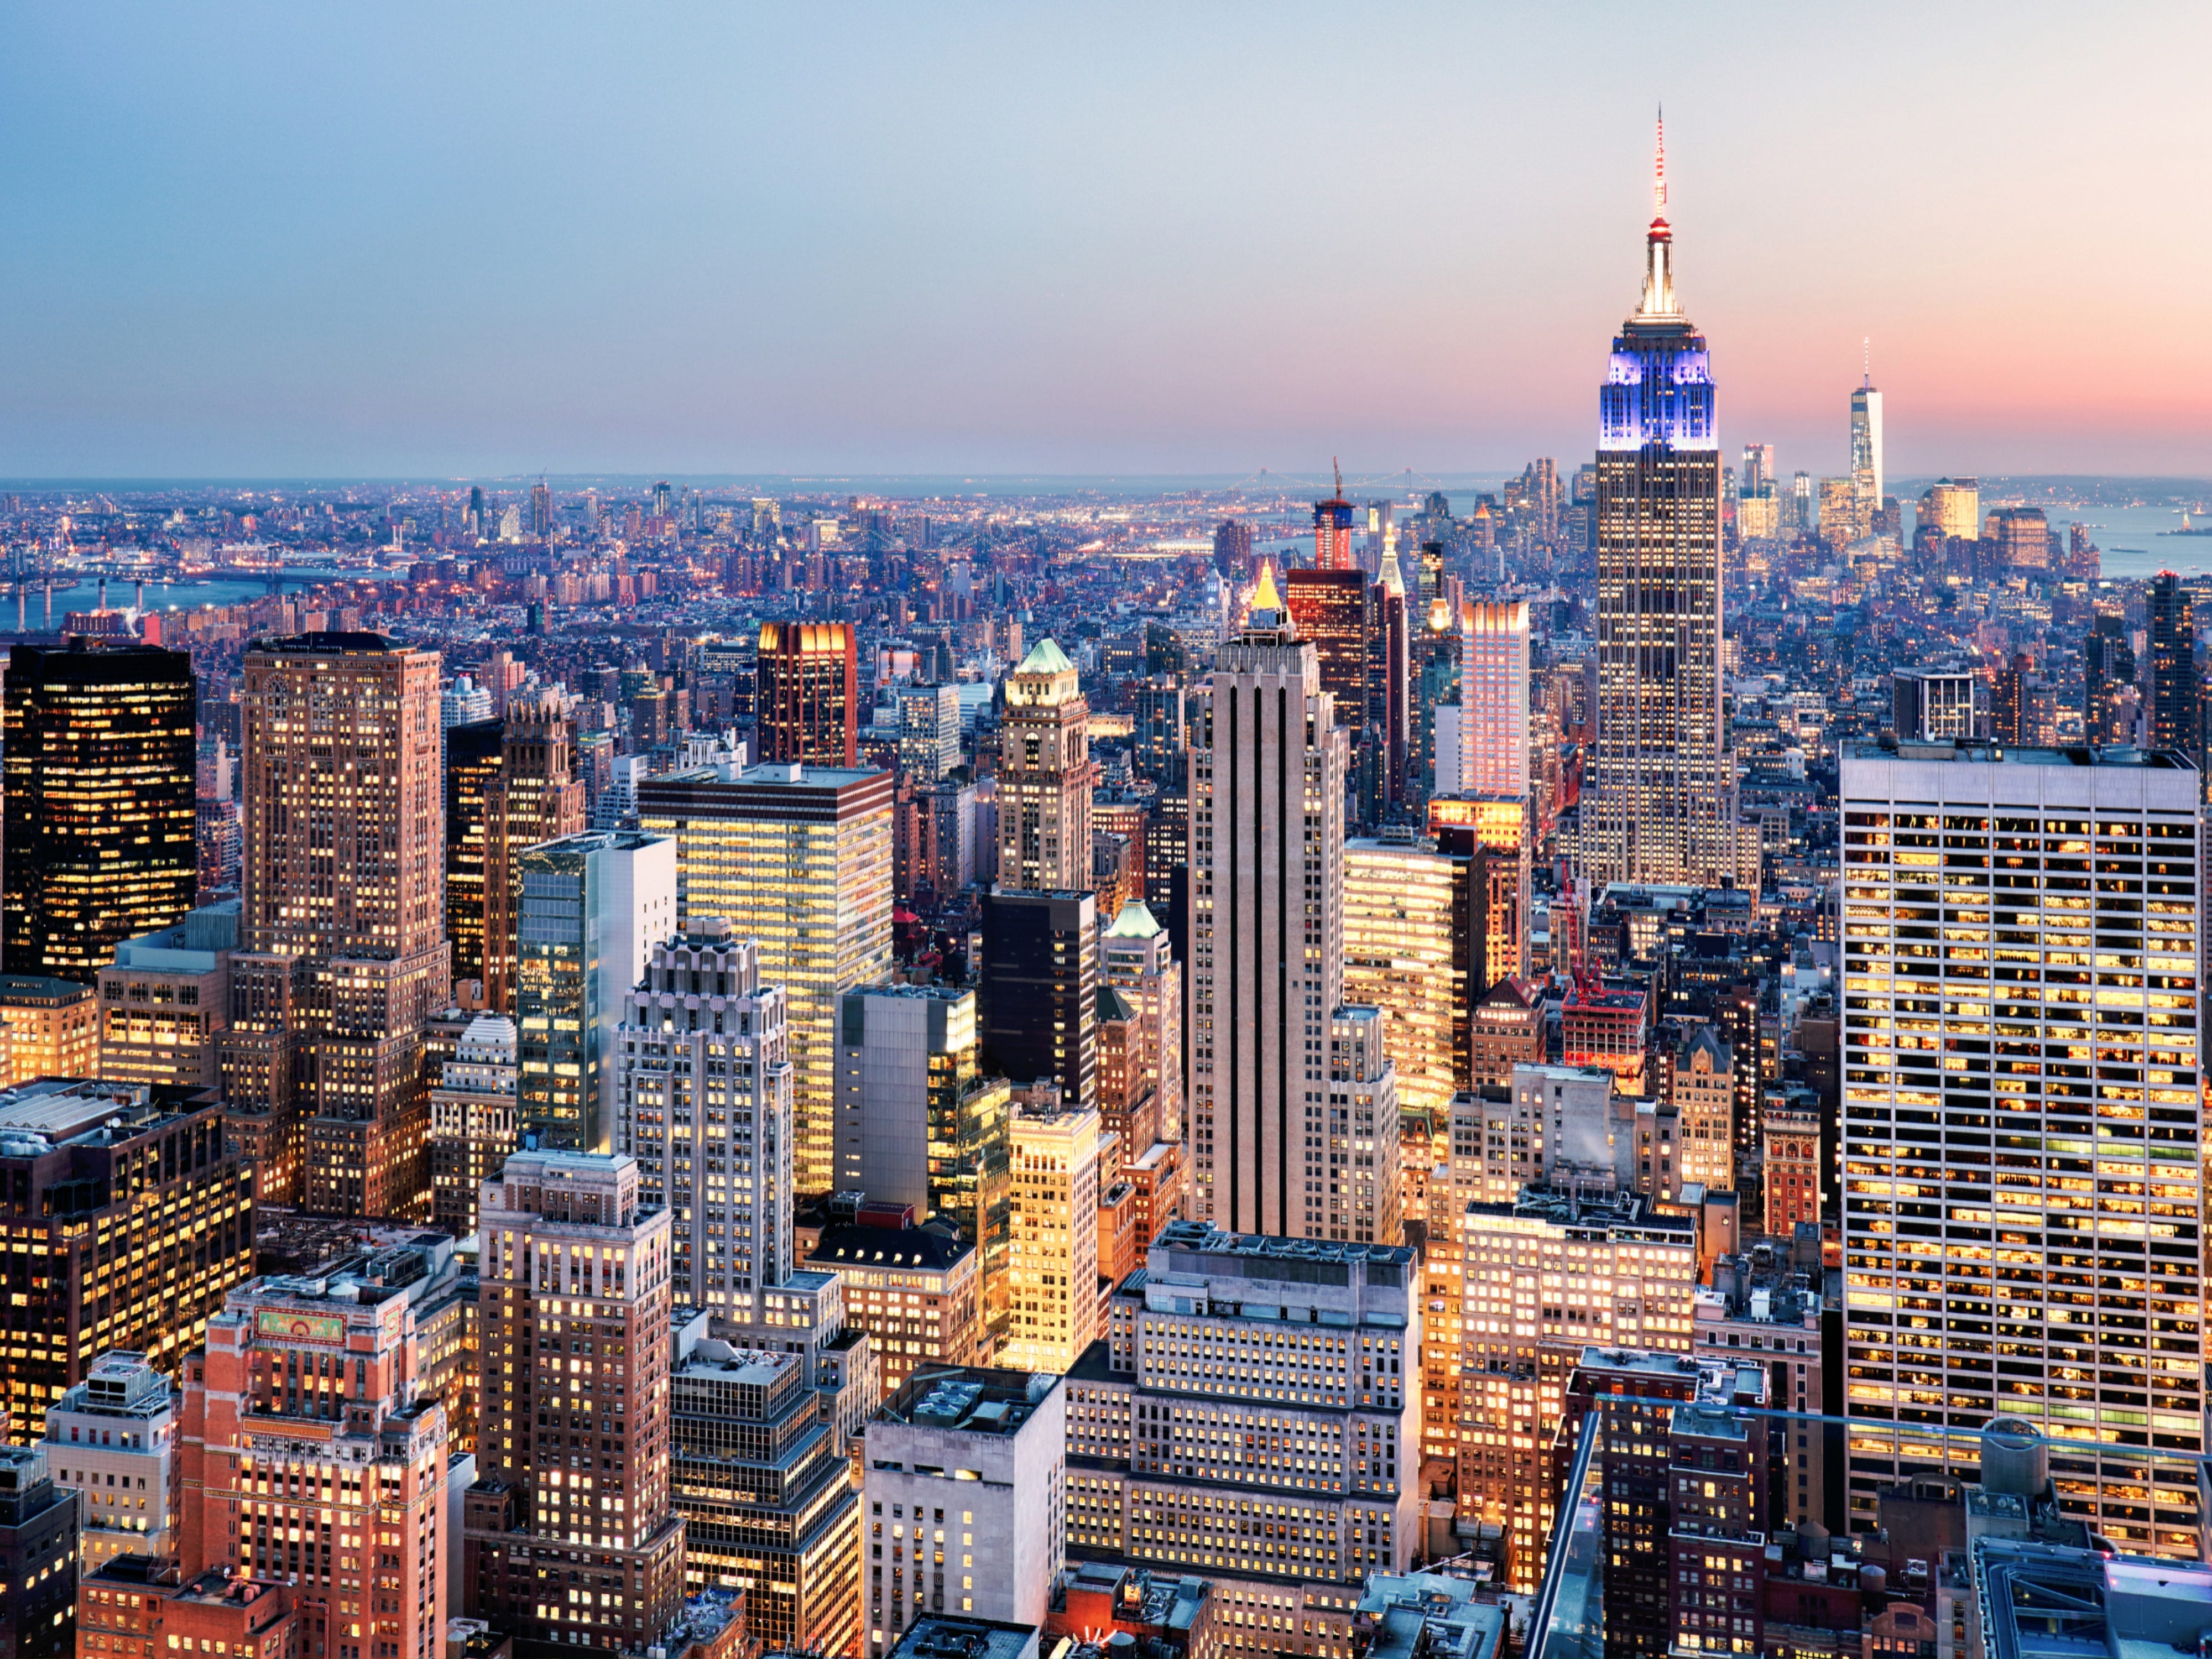
TTstudio/Shutterstock
Claims per 100,000 people in the workforce: 167
Week-over-week increase: 12.20%
Increase in unemployment claims in 2025 compared to last year: 13.69%
8. Mississippi
John Coletti/Getty Images
Claims per 100,000 people in the workforce: 97
Week-over-week increase: 35.68%
Increase in unemployment claims in 2025 compared to last year: 6.92%
7. Virginia

Sky Noir Photography by Bill Dickinson/Getty Images
Claims per 100,000 people in the workforce: 52
Week-over-week increase: 3.84%
Increase in unemployment claims in 2025 compared to last year: 43.77%
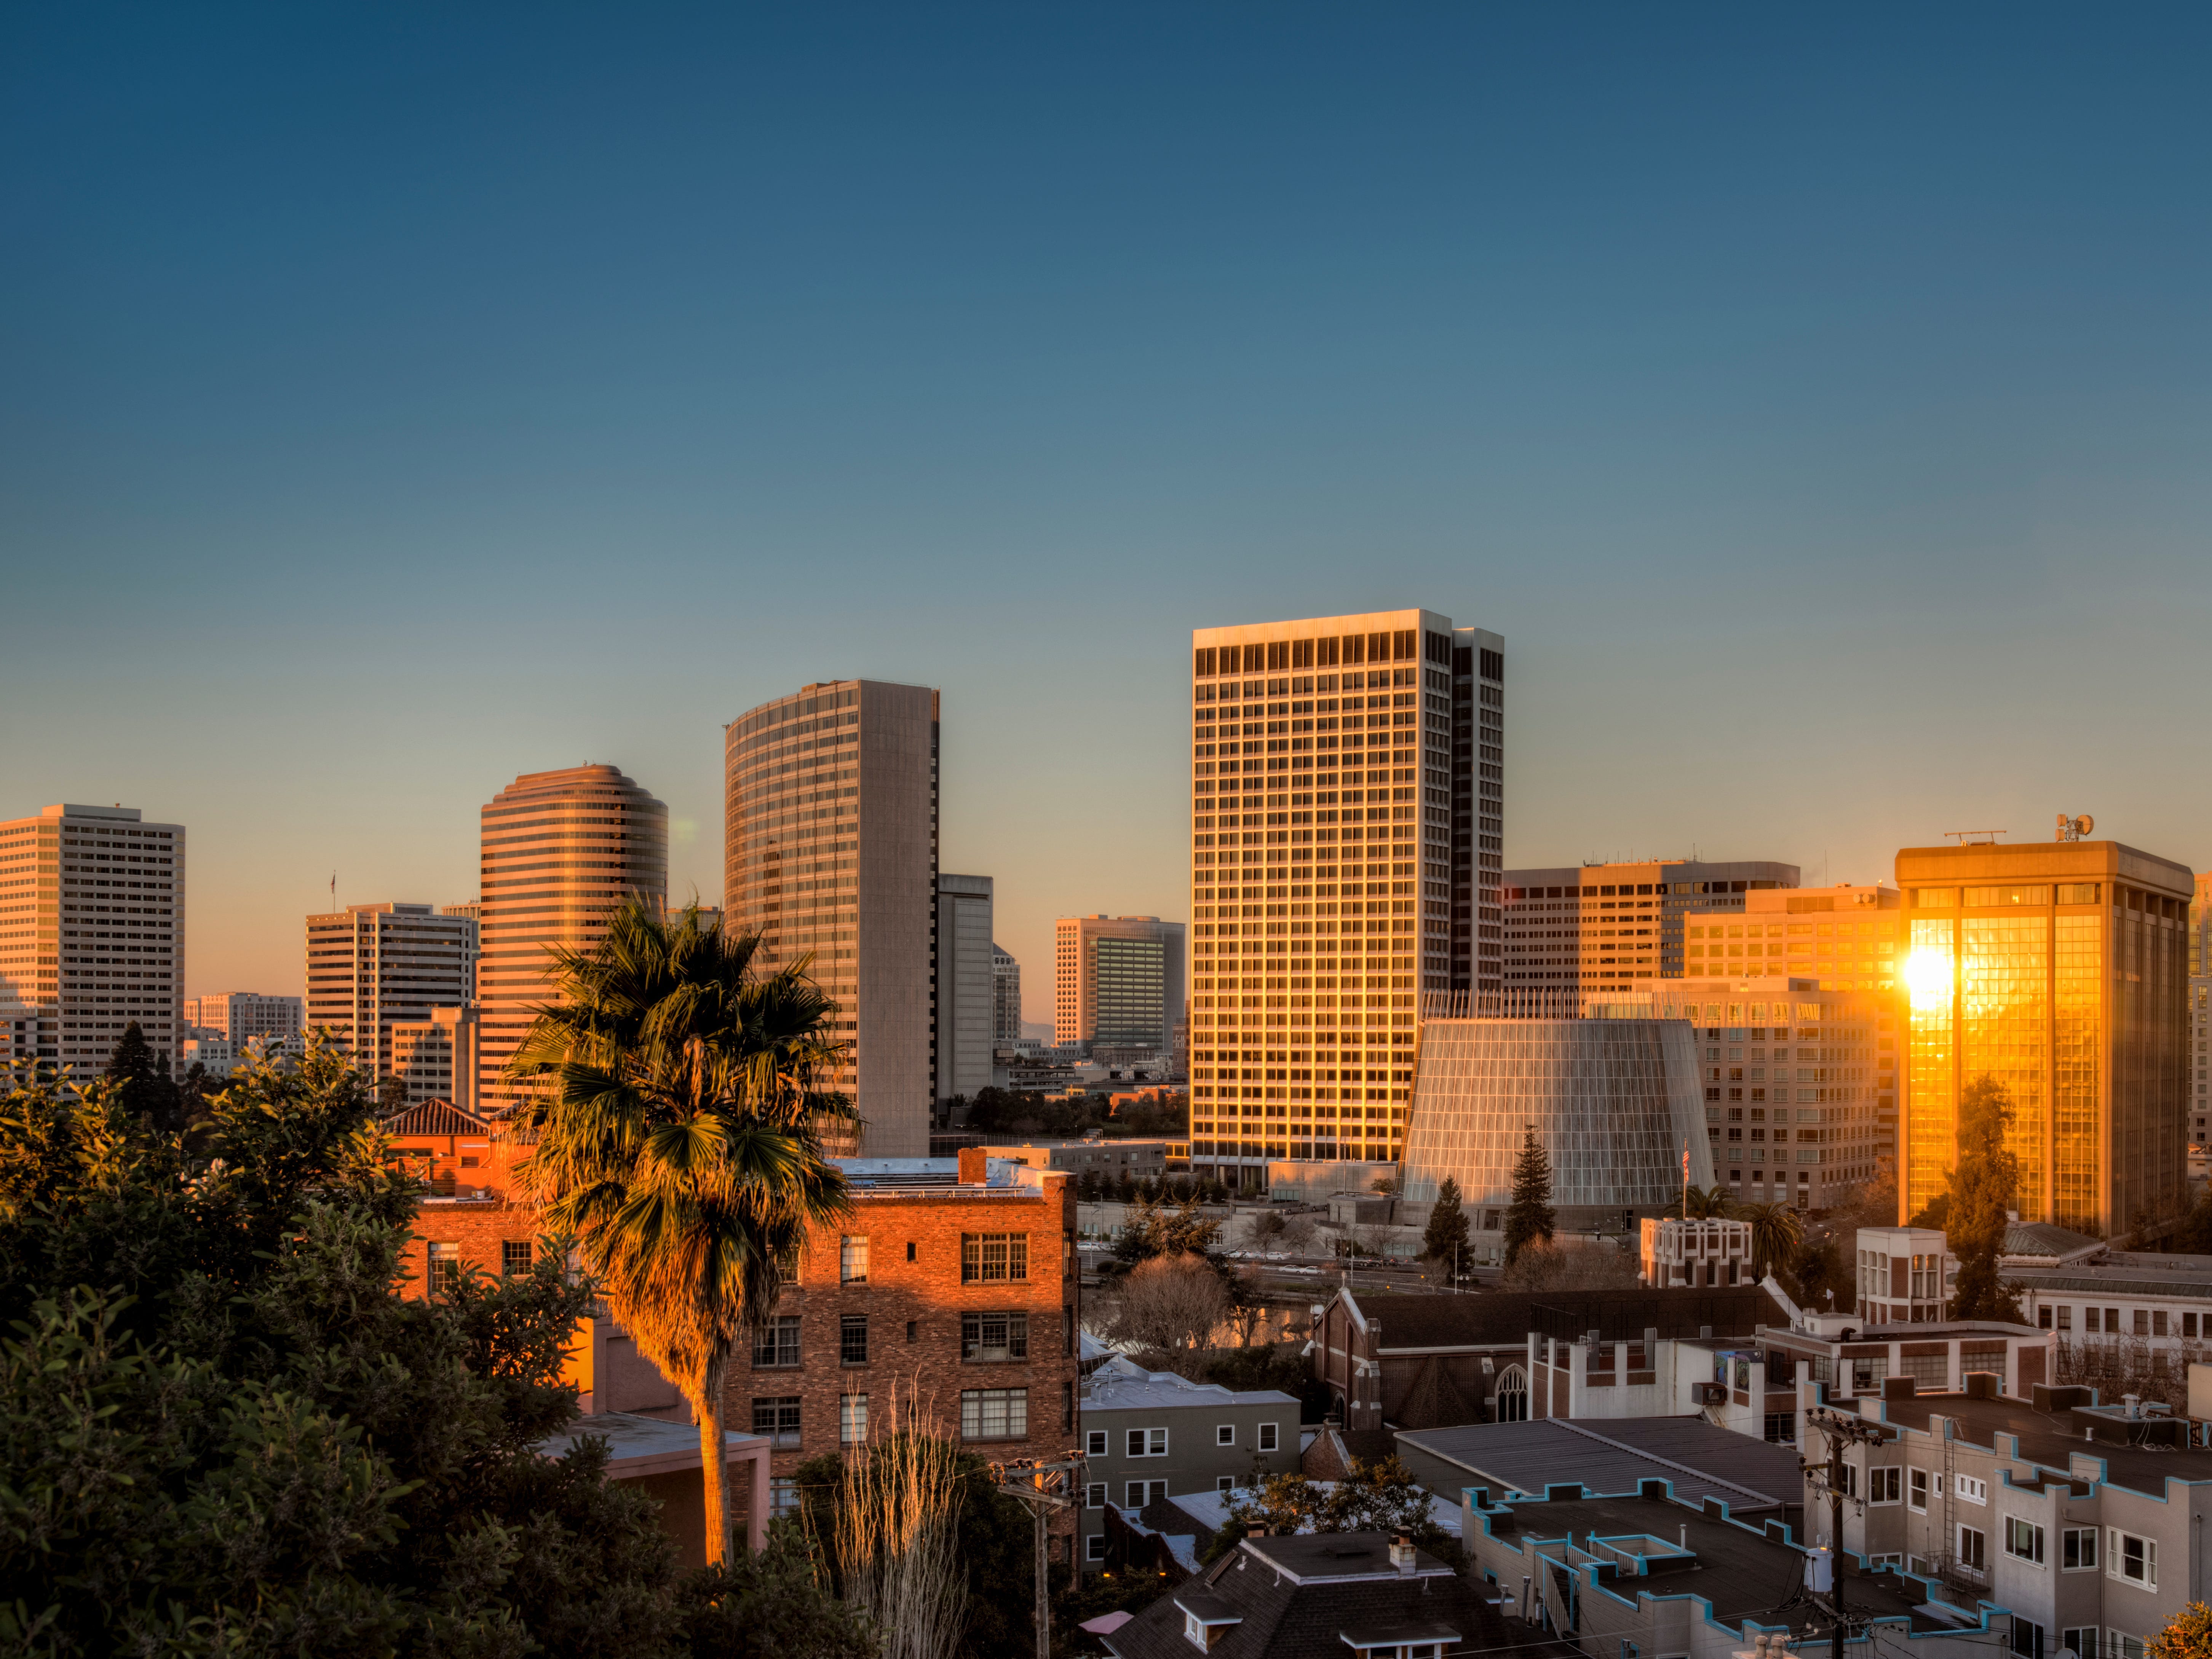
6. Oregon
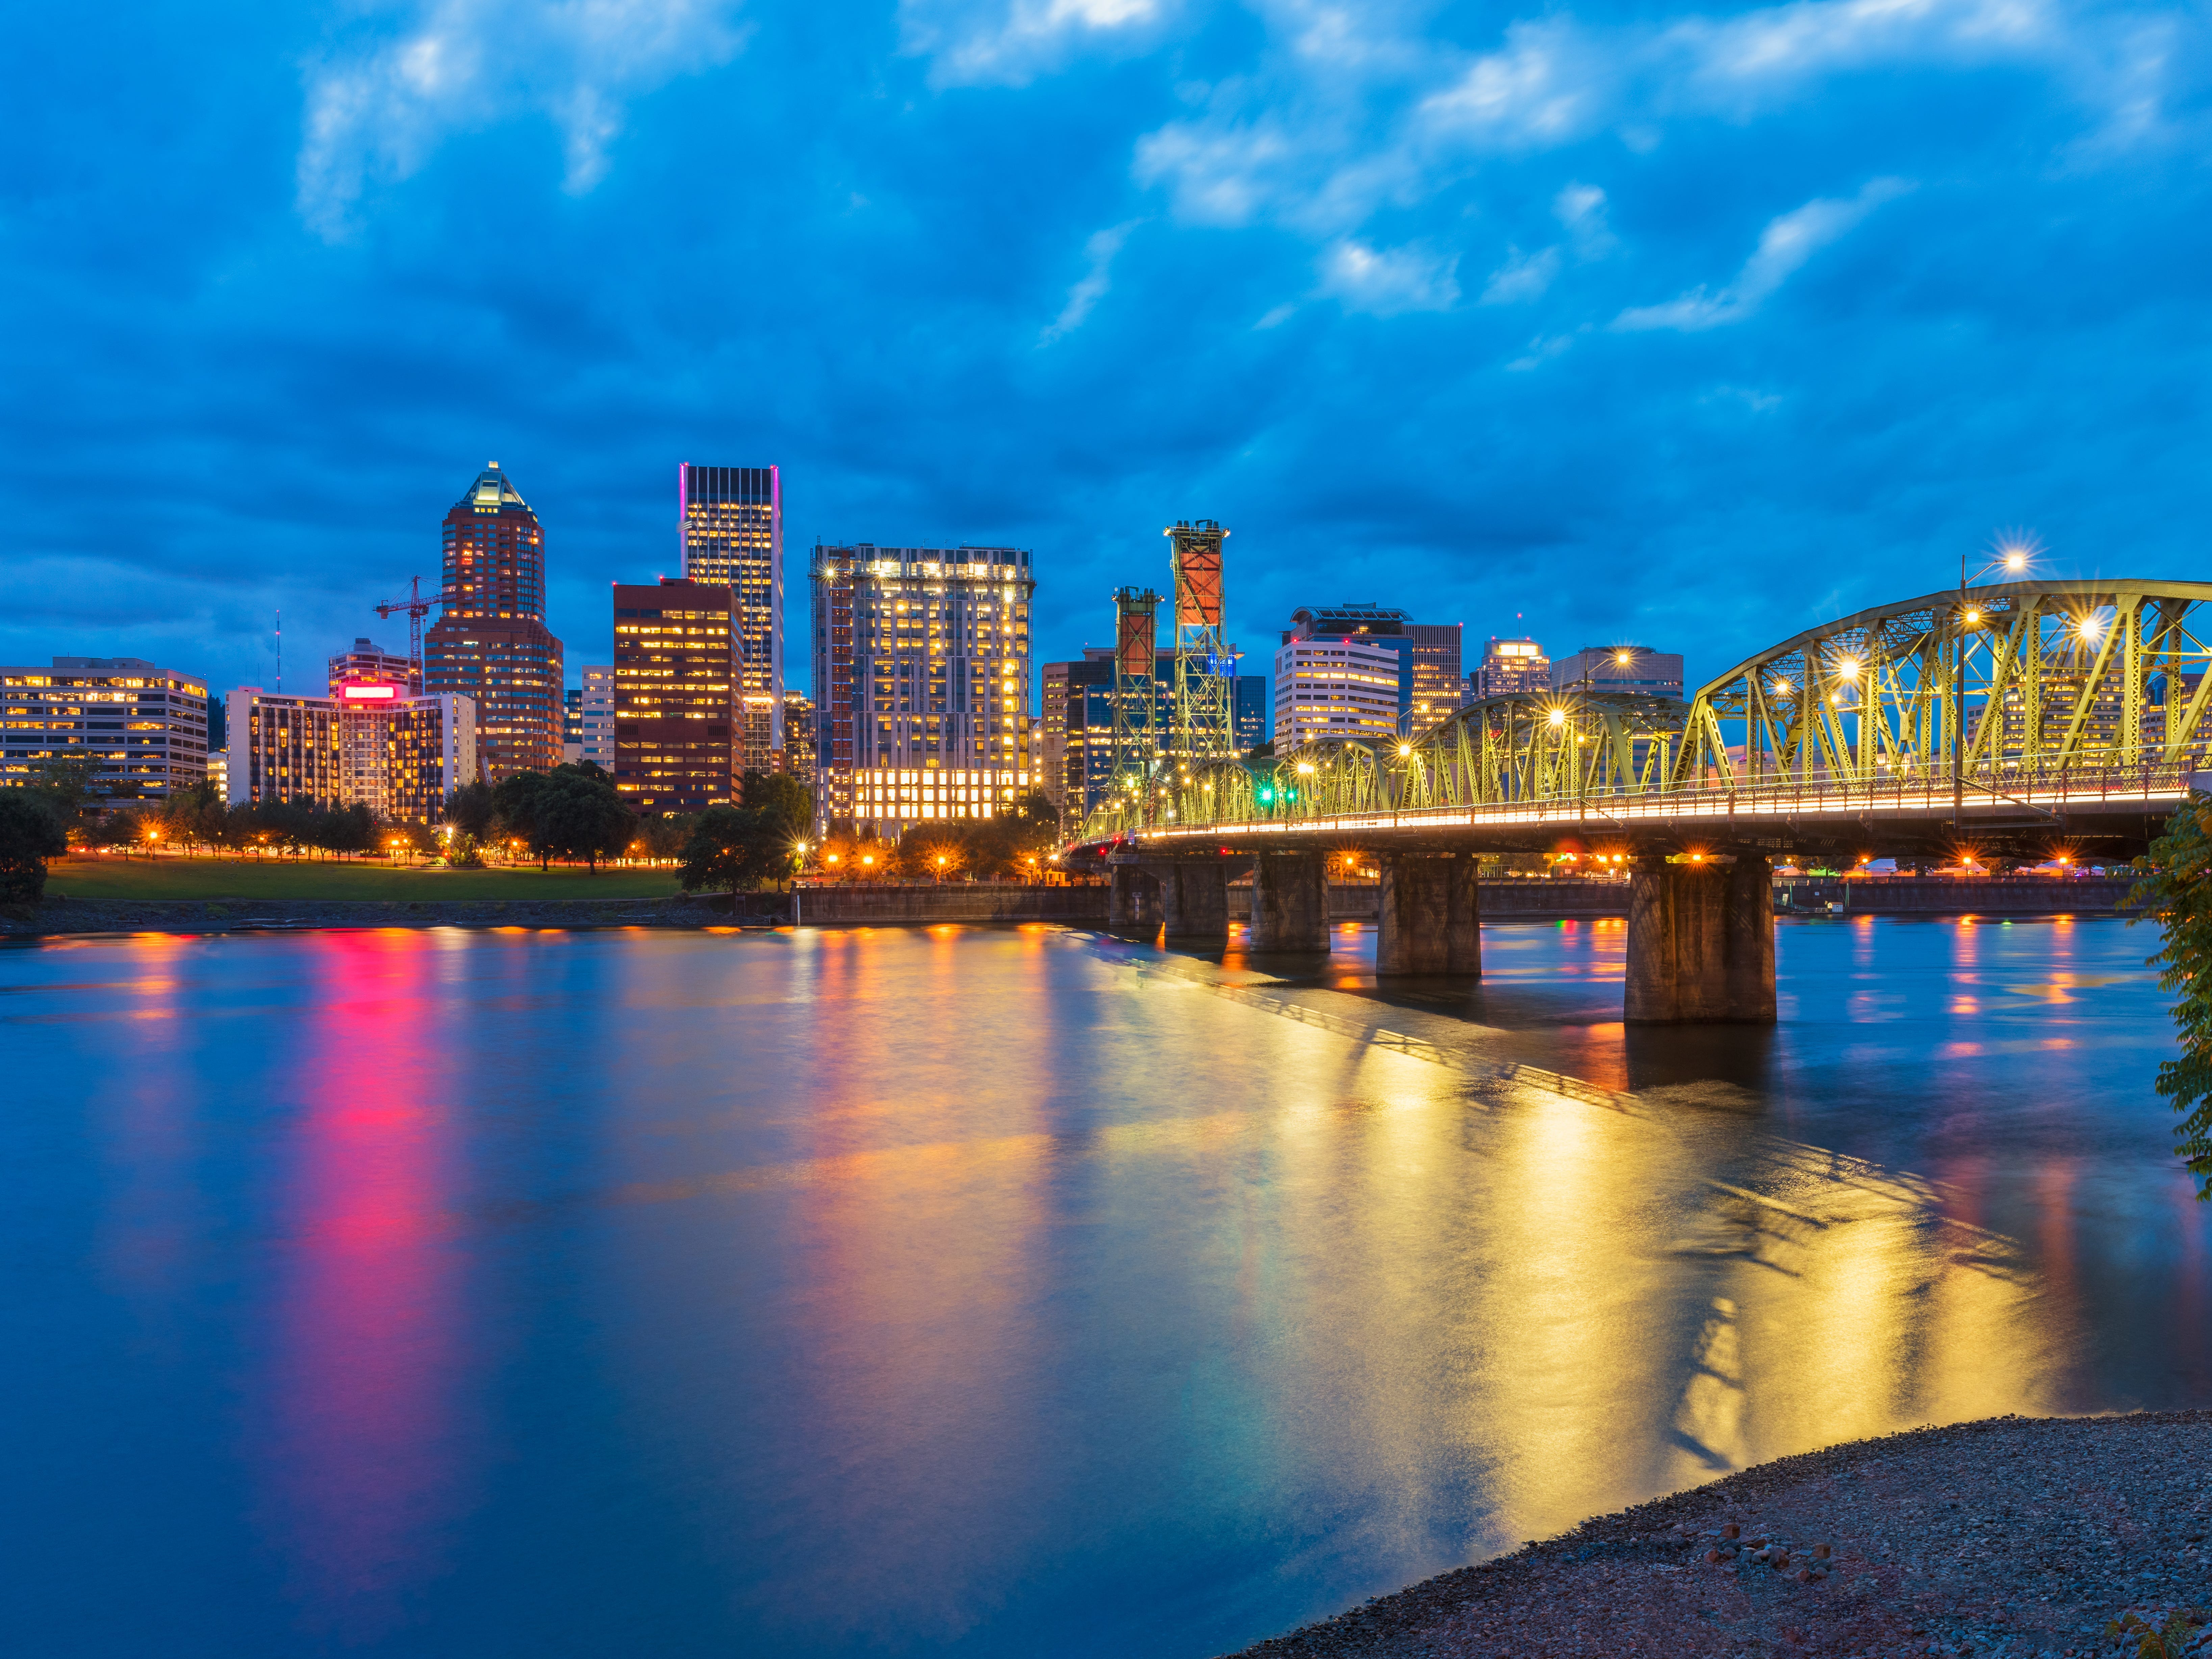
© Allard Schager/Getty Images
Claims per 100,000 people in the workforce: 190
Week-over-week increase: 12.17%
Increase in unemployment claims in 2025 compared to last year: 18.58%
5. Illinois
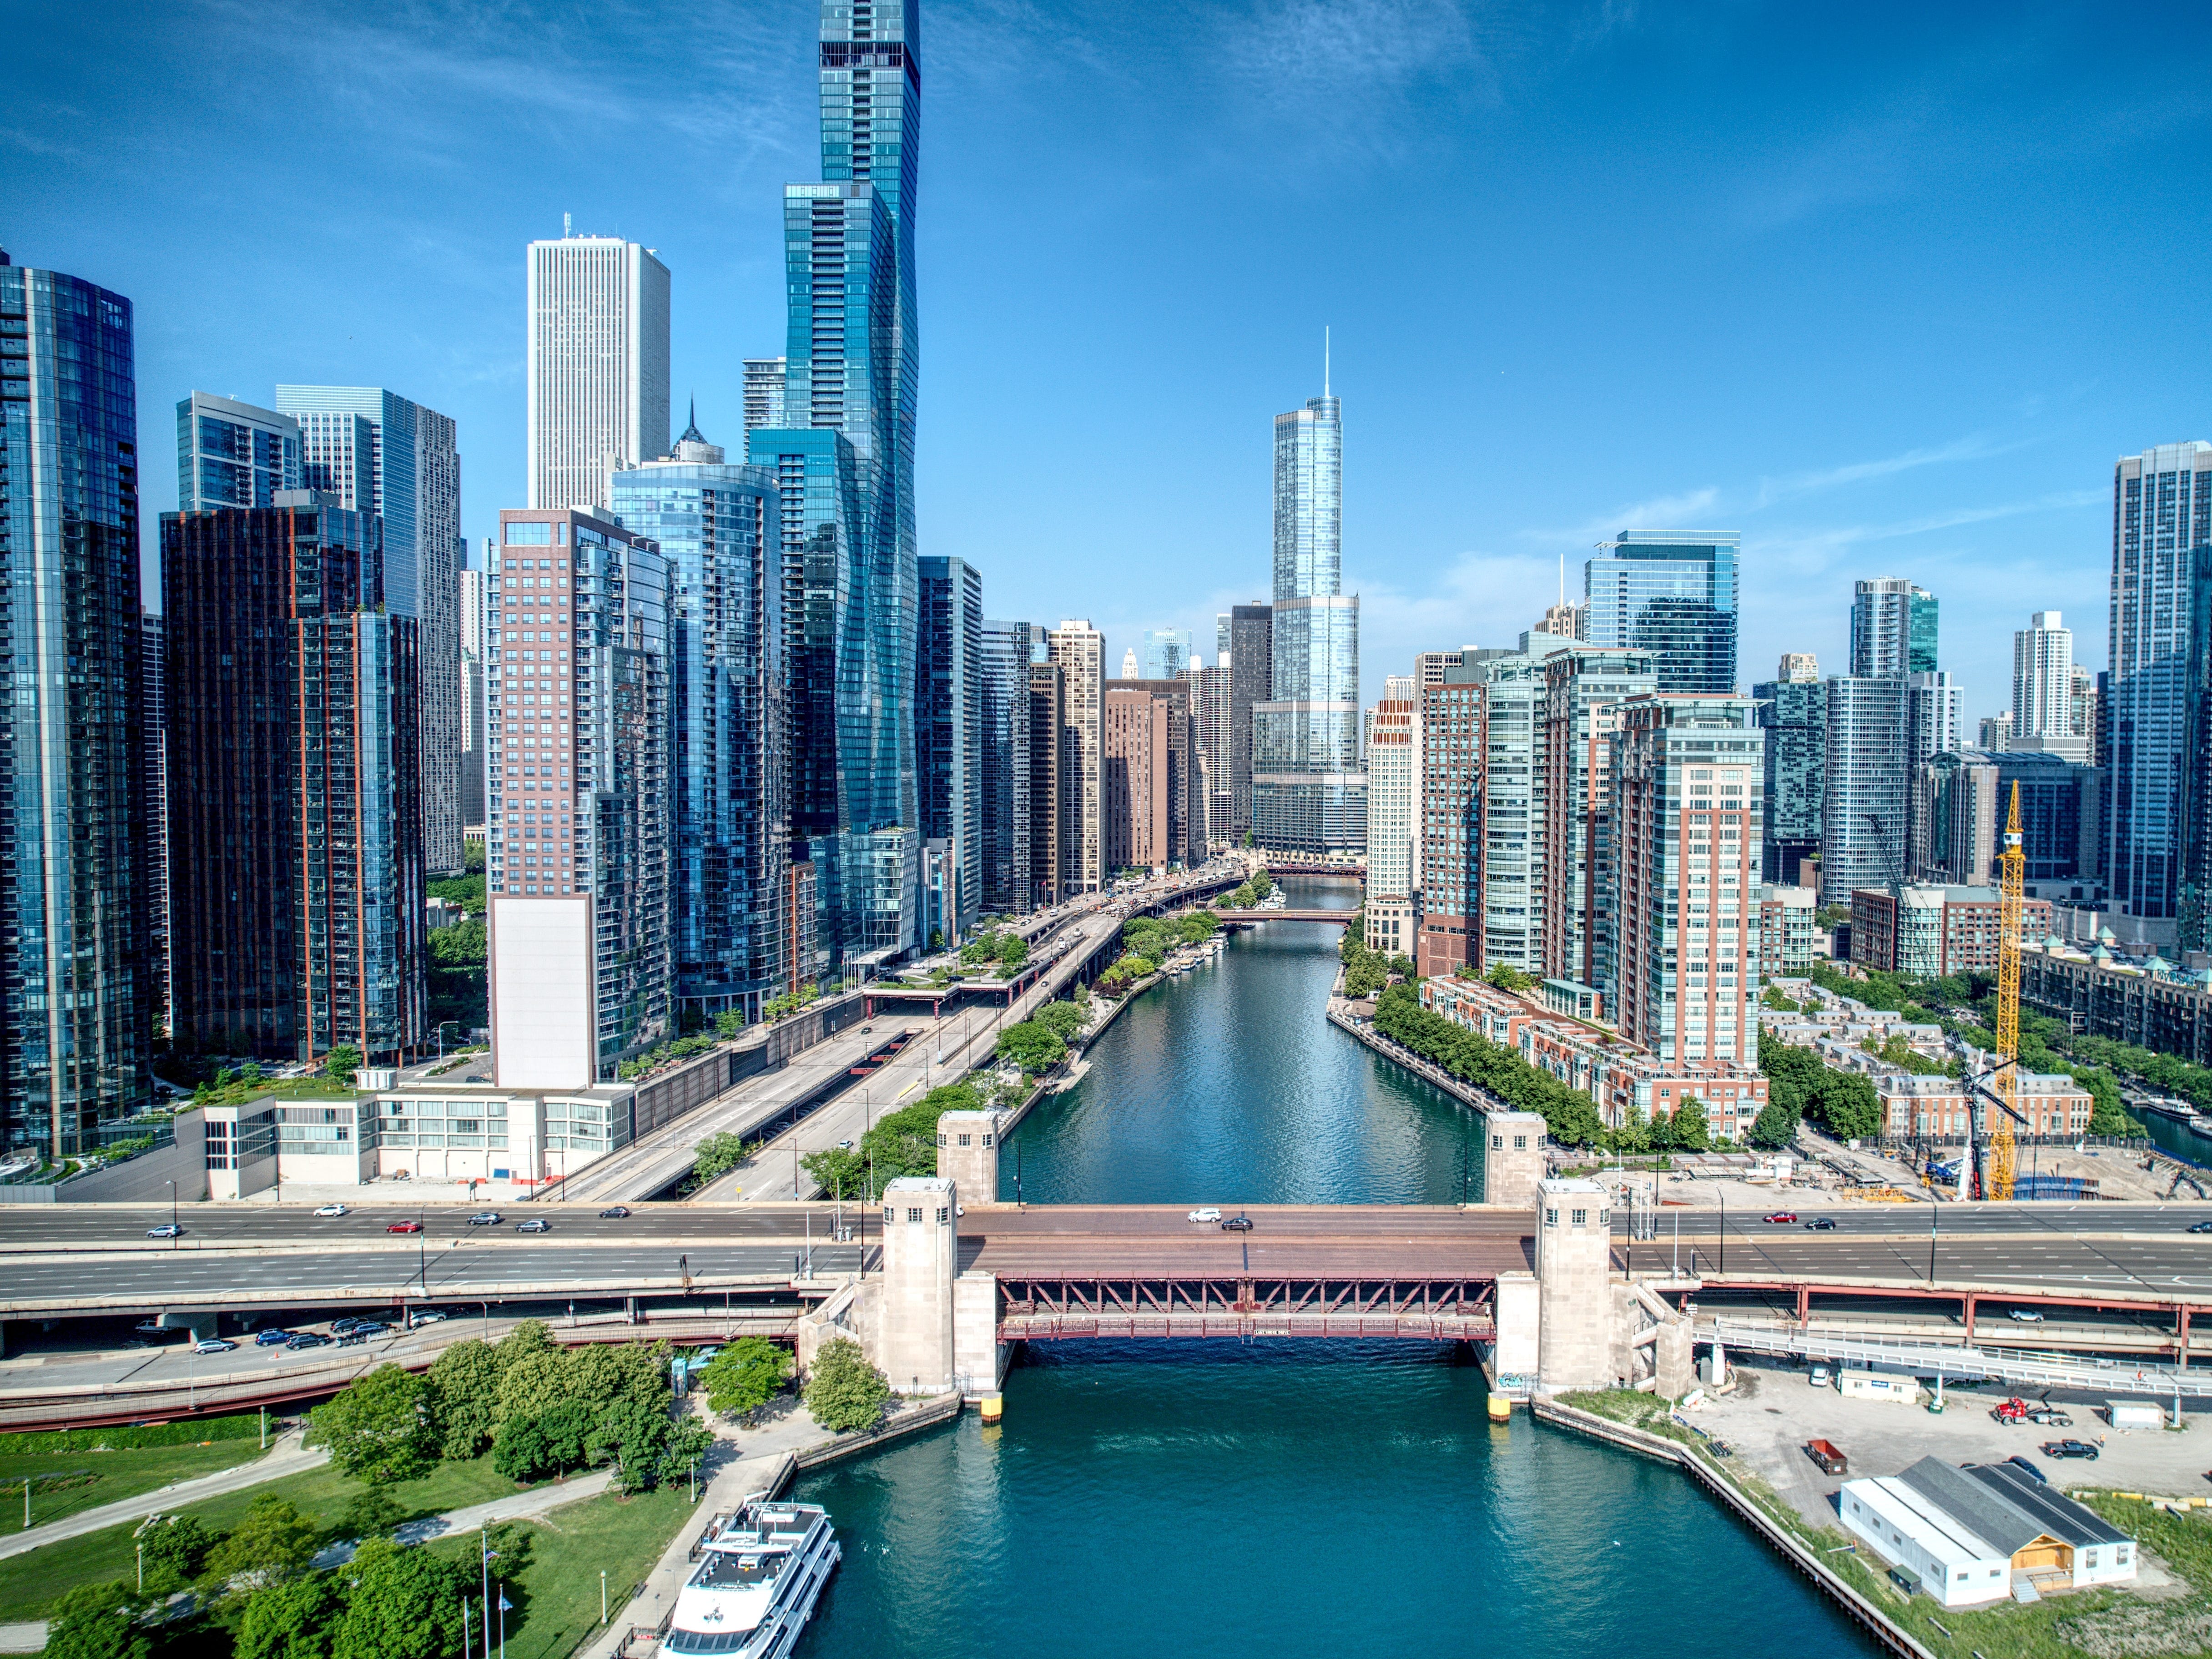
Moses P/Shutterstock
Claims per 100,000 people in the workforce: 170
Week-over-week increase: 13.74%
Increase in unemployment claims in 2025 compared to last year: 28.61%
4. Nebraska
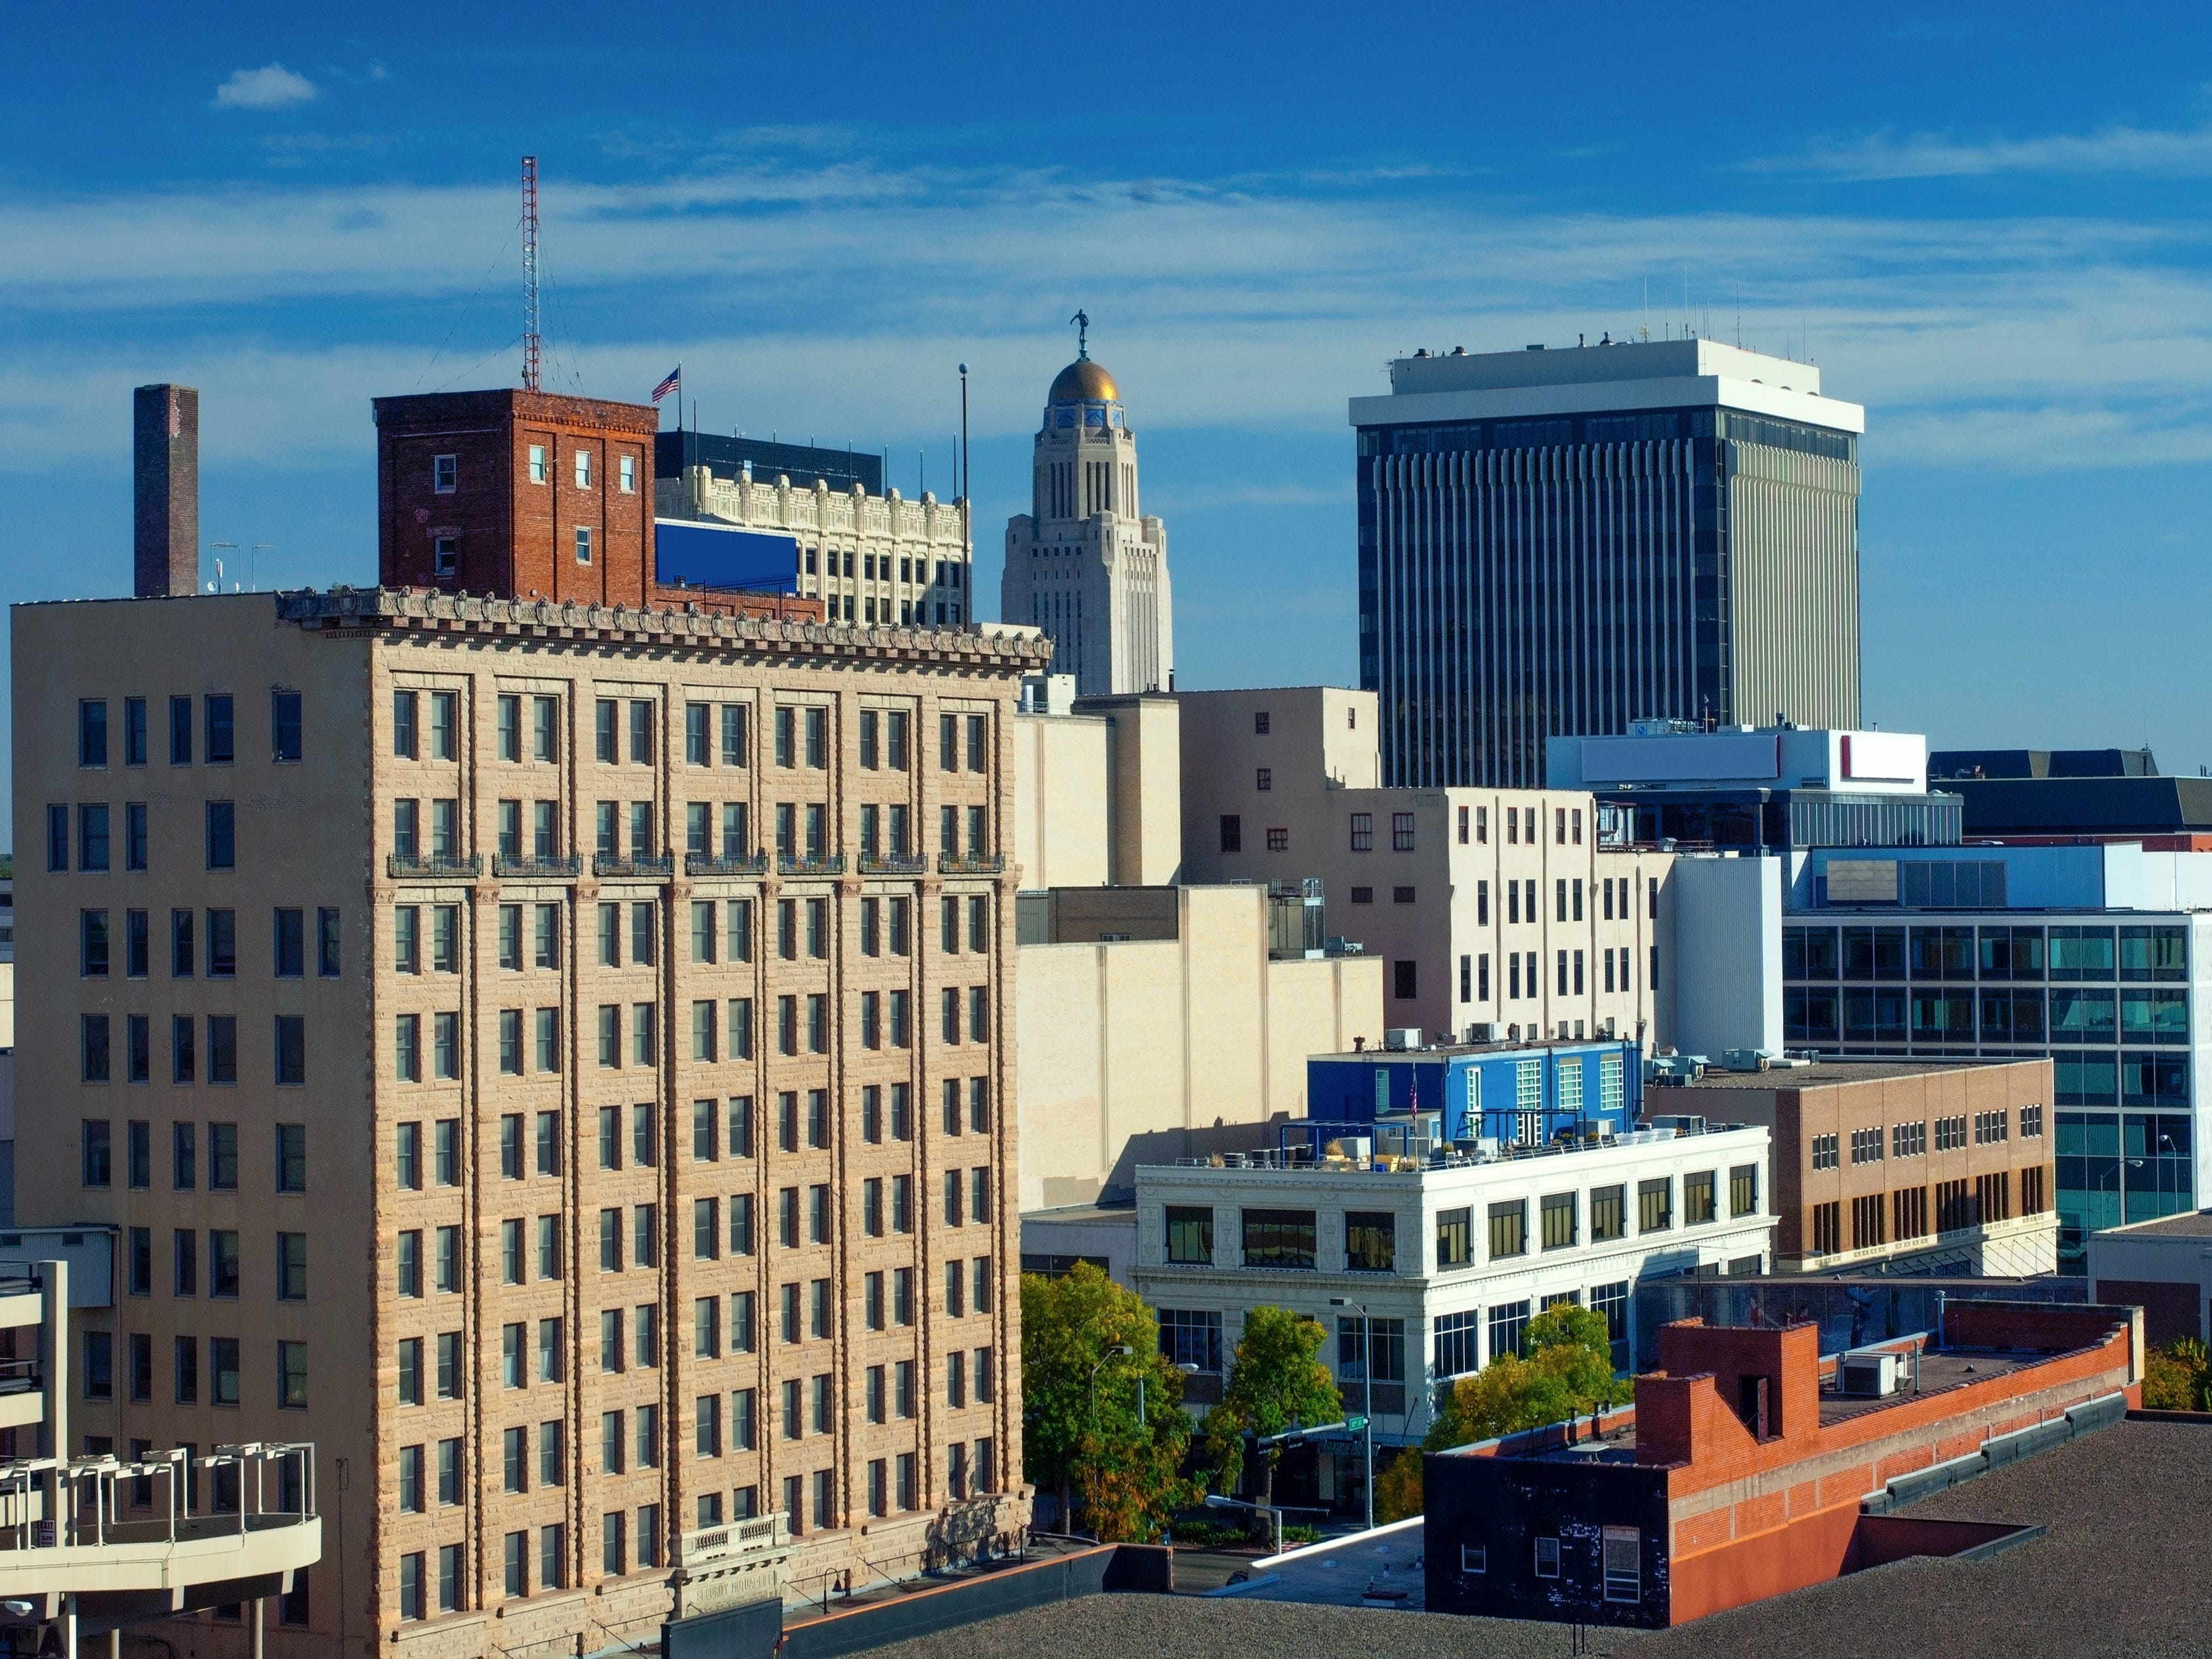
John Coletti/Getty Images
Claims per 100,000 people in the workforce: 86
Week-over-week increase: 63.21%
Increase in unemployment claims in 2025 compared to last year: 35.08%
3. District of Columbia
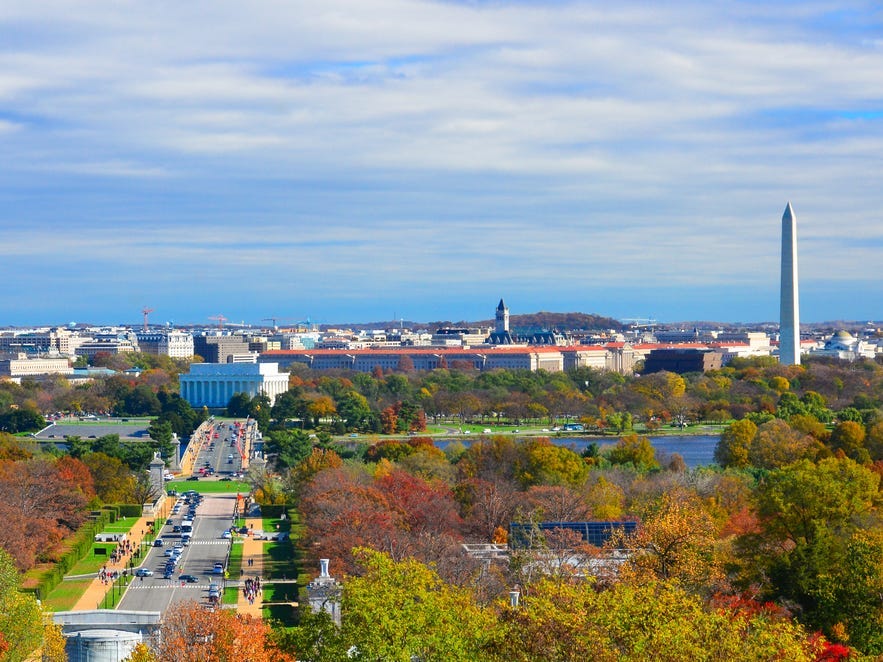
Orhan Cam/Shutterstock
Claims per 100,000 people in the workforce: 158
Week-over-week increase: 4.67%
Increase in unemployment claims in 2025 compared to last year: 105.36%
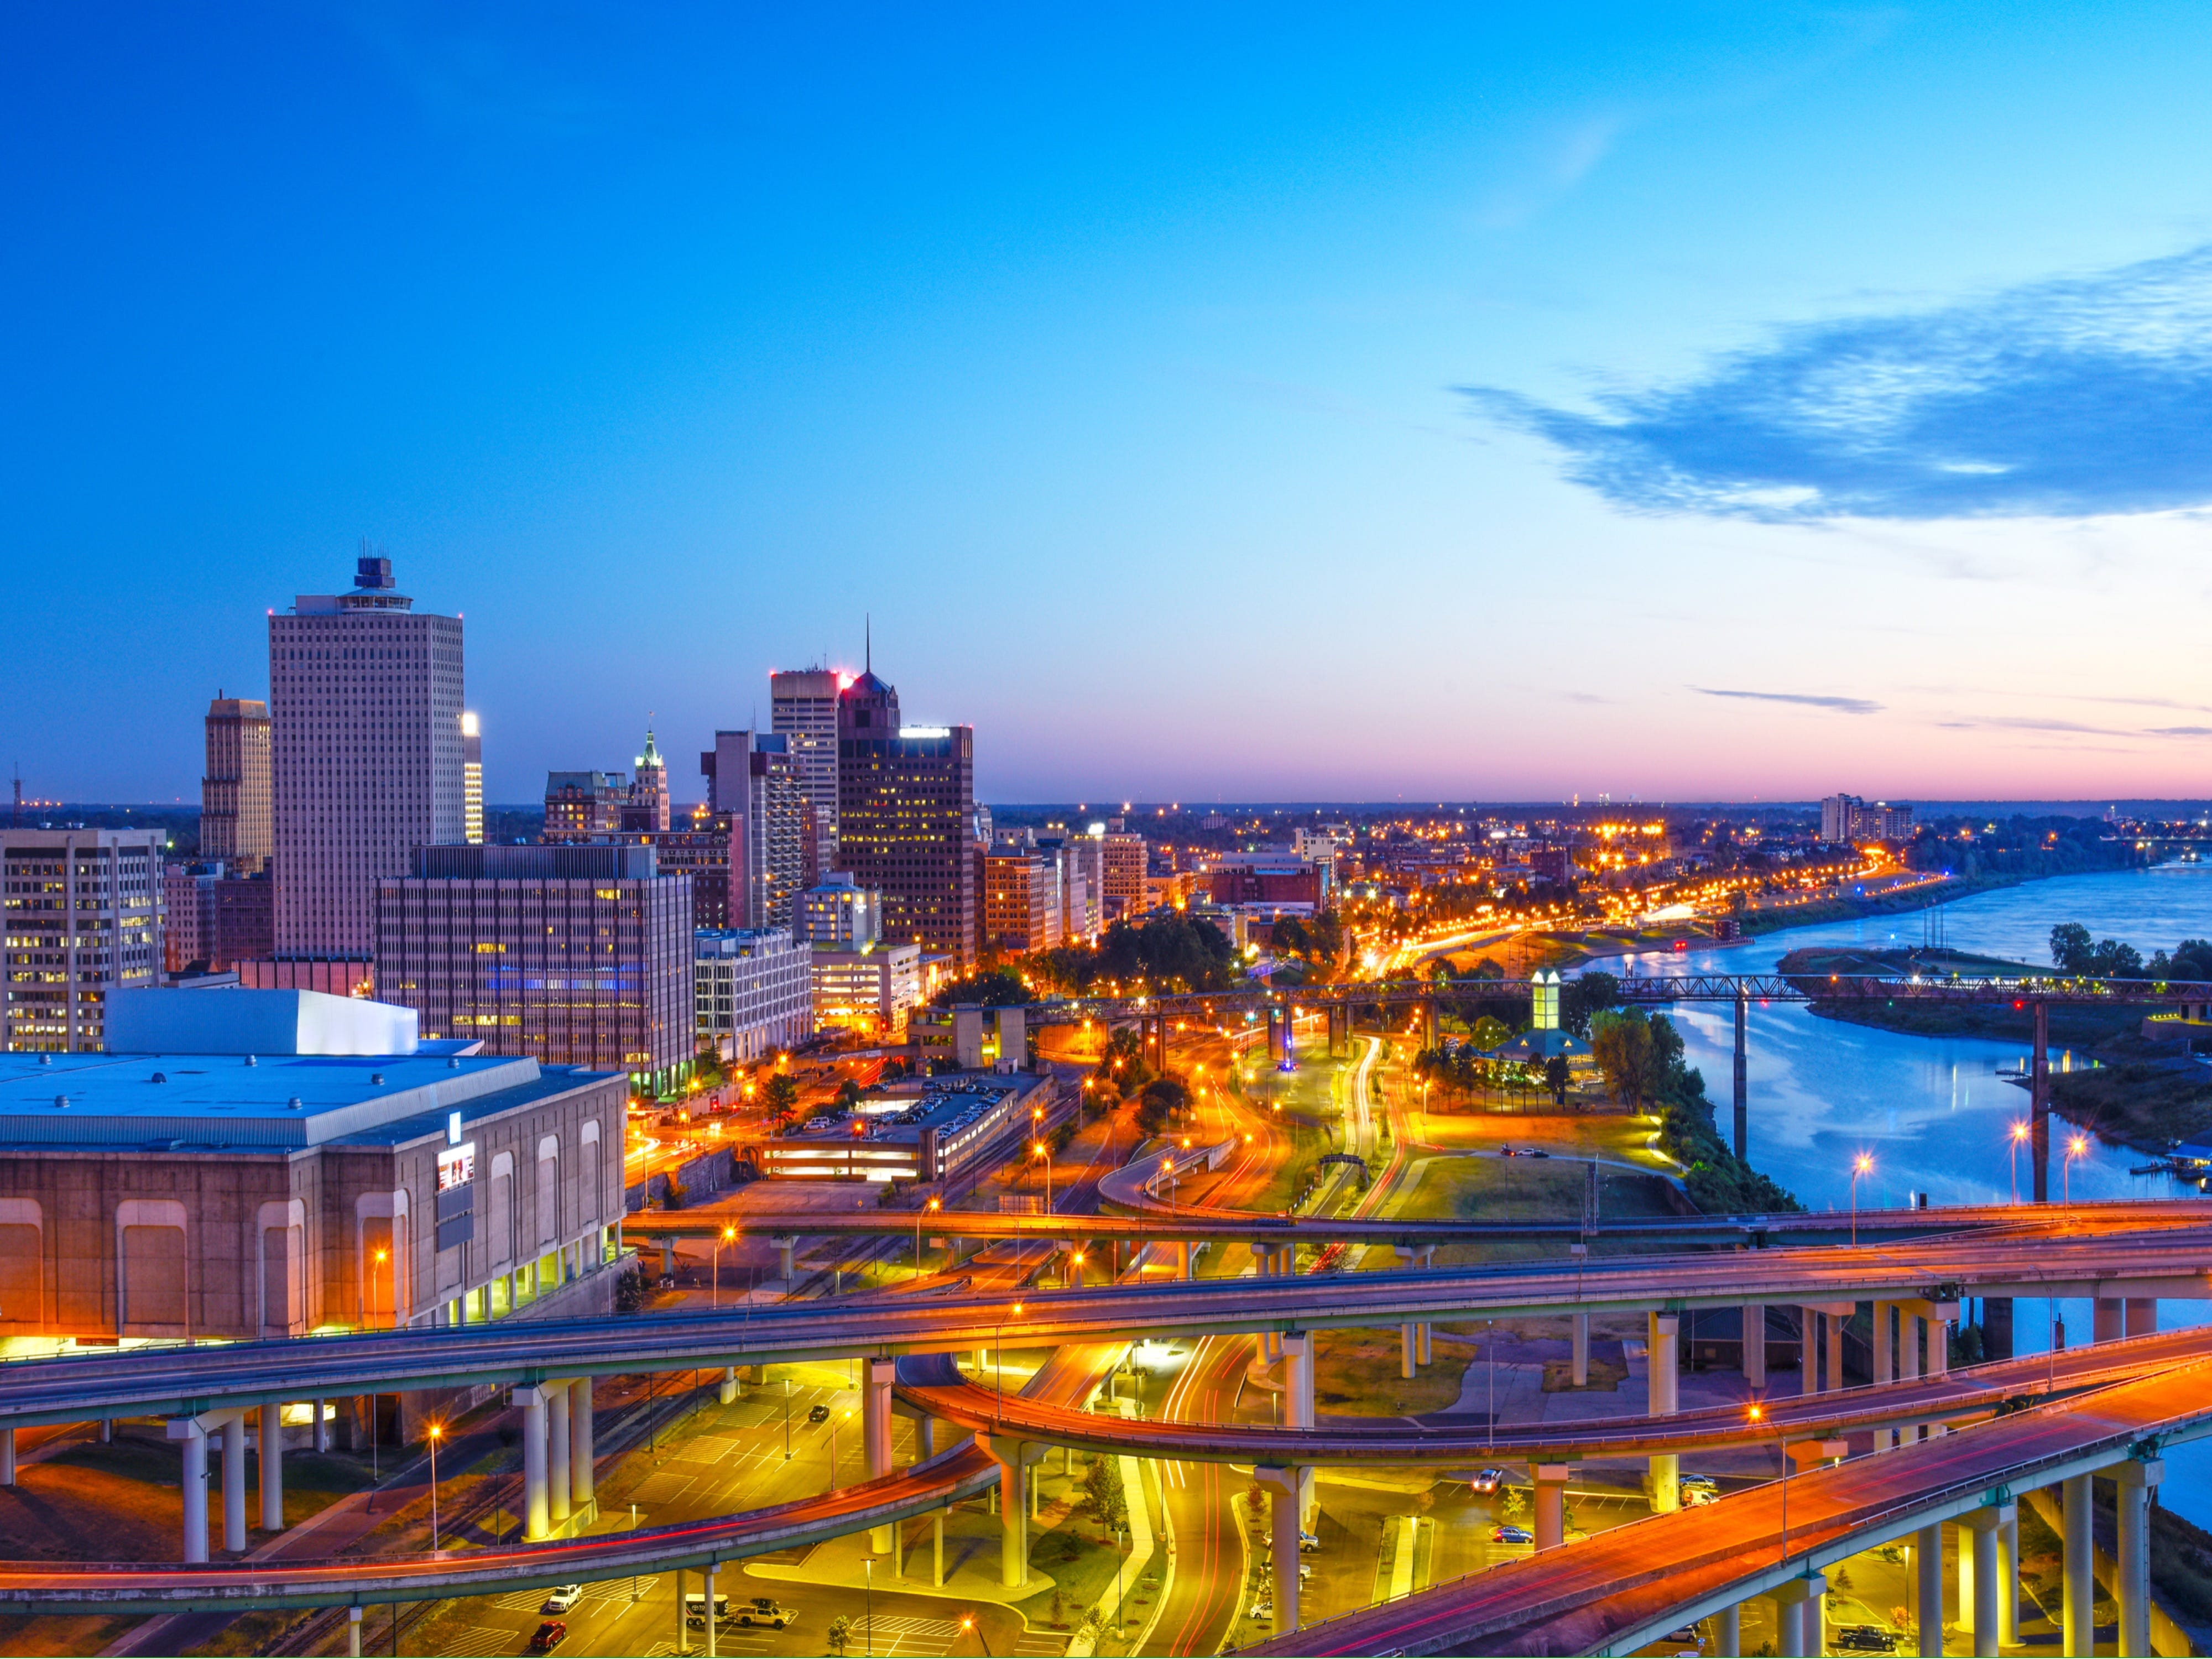
2. Tennessee
Adina Olteanu/Getty Images
Claims per 100,000 people in the workforce: 163
Week-over-week increase: 103.09%
Increase in unemployment claims in 2025 compared to last year: 18.68%
1. Connecticut
f11photo/Shutterstock
Claims per 100,000 people in the workforce: 317
Week-over-week increase: 89.26%
Increase in unemployment claims in 2025 compared to last year: 17.62%
The post The US has more job seekers than open jobs. These 10 states are seeing the biggest increases in unemployment claims. appeared first on Business Insider.