It began on a whim, and a little bit of pressure from their boss — two meteorologists in 1948 trying to do what no one had done before: accurately forecast a tornado.
Five days earlier, one had destroyed an Oklahoma military base, and the Air Force was desperate to avoid a repeat. Using paper maps and pencils, they painstakingly plotted the conditions of the atmosphere, taking care to note where they might align to create the dangerous mix from which another tornado could spout.
Three-quarters of a century later and about 25 miles away from where that base stood, the scientists at the Storm Prediction Center, an arm of the National Weather Service, are on the job. Working with artificial intelligence, radar and satellites, they have the benefit of modern technology their predecessors could only have dreamed of to watch storms in real time.
But one thing has never changed: They still swear by those paper maps and pencils.
“A Norwegian meteorologist decades ago said analyzing a weather map by hand allows you to feel the weather in your veins,” said Bill Bunting, the deputy director at the prediction center. He leaned over a stack of paper maps as a tornado watch was being issued for Chicago. “You just get it into your head in a different manner.”
More than three dozen severe-weather experts at the prediction center work in shifts year-round to forecast thunderstorms, hail, damaging winds and wildfire weather.
John Hart, a lead forecaster, described the unit’s work as a unique niche in the federal weather apparatus. While more than 100 individual Weather Service offices focus on their local geographical territories, the prediction center’s forecasters track threatening weather as it moves across the whole country.
Each shift is defined by a specific rhythm and a sense of professional urgency; a clock ticks down toward the moment the forecast must be issued. To find their bearings, forecasters often begin their work by hand-plotting the current weather, much as their predecessors did in 1948.
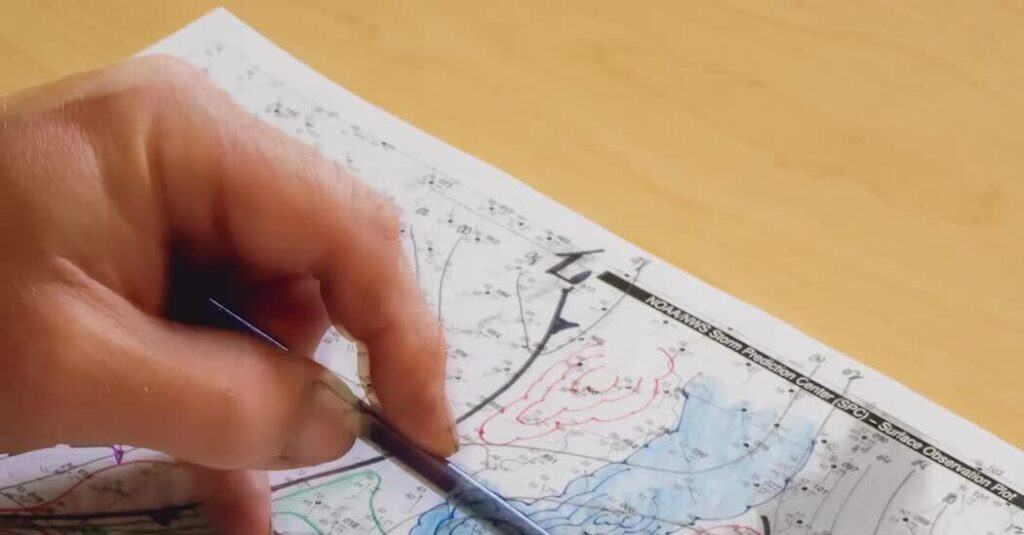
They print a large map of the United States. It shows the familiar outlines of coastlines and state borders, but it is also crowded with “wind barbs” — tiny dots with lines extending from them. The lines point toward the direction from which the wind is blowing; triangles attached to them indicate wind speed. Numbers huddled next to the dots represent surface pressure, temperature and dew point readings.
With the focus of a child doing a connect-the-dots assignment, the forecasters begin to draw.
They find similar temperatures and trace lines called isotherms between them. Forecasters have different styles, drawing intervals every two, five or 10 degrees. Warmer and colder areas are shaded in blue, purple, orange or yellow. They connect pressure readings to create gradients, revealing the location of the low- and high-pressure areas that drive the wind.
Next, they map moisture, using green or blue for humidity and yellow or brown for dry air.
For a severe storm to form — the kind that can produce a tornado, but also hail and heavy rain — these ingredients must be forced to mix, usually at the “collision” of air masses. This is where the fronts appear: the blue lines with triangles and red lines with half-circles that mark the leading edge of an air mass. There is also the “dry line,” a dashed black line indicating the division between dry air and the warm, moist air that fuels a tornado.
These boundaries are the landmarks the forecasters look for before they turn toward their computer screens.
Debris filled the air as the funnel moved toward the northeast edge of the Tinker Air Force Base in Oklahoma on March 20, 1948. It struck at 10 p.m., shattering the glass of the runway control tower and injuring the people inside. It was not a happy night for the commander, Maj. Gen. Fred S. Borum.
Maj. Ernest J. Fawbush and Capt. Robert C. Miller spent the days after analyzing surface maps and air charts from the day of the tornado, searching for the conditions that led to the disaster.
On the morning of March 25, according to a manuscript Captain Miller wrote years later, they noted a pattern on their charts that looked nearly identical. General Borum arrived at the weather station and asked a question: “Are you planning to issue a tornado forecast for Tinker?”
They hedged, settling on a warning for heavy thunderstorms.
But as the afternoon progressed, their radar display, repurposed from World War II bombers, began showing storms 60 miles to the northwest. By 2:30 p.m., a line of them was moving toward the base. General Borum, also struck by the similarities between the two days, asked again if they would issue a tornado forecast.
The men hesitated, still unsure that it would happen, but they composed the message and passed it to Base Operations at 2:50 p.m.
Shortly after 5 p.m., the storms passed near Will Rogers Municipal Airport, which reported only a light thunderstorm and pea-sized hail. Believing the forecast was a bust, Captain Miller drove home dejected. He was sitting in his house when a bulletin interrupted the radio with news of the second tornado.
He returned to the base to find a shambles but a jubilant Major Fawbush. At 6 p.m., two thunderstorms had joined. A cone-shaped cloud bulged down. Observers saw a wing from a mothballed World War II B-29 bomber float upward before the funnel disintegrated.
Their success that day in recognizing the pattern propelled the modern system for forecasting severe storms.
Today, desks at the Storm Prediction Centers are brimming with computer screens. This team, Mr. Hart said, is “essentially a human ensemble of a century of experience trying to get to the right answer quickly.”
And beside each desk is a blank spot for drawing maps.
Newcomers at the center are taught the analog tradition and given a pencil box. Mr. Hart, dumping his out on the table, said his container, held together by packaging tape, had belonged to a predecessor, Jack Hales, whose daughter had used it in school before he brought it to work in 1974.
These days, the Storm Prediction Center can forecast the possibility of severe storms up to eight days in advance, and the forecasts grow more detailed and accurate as the date approaches.
By the day of severe weather arrives, the prediction center issues what they call the severe storm outlooks, which tell people on the ground the probability and — new in 2026 — the potential intensity of the weather they may face.
Then it’s time to wait, and watch.
Judson Jones is a meteorologist and reporter for The Times who forecasts and covers extreme weather.
The post When Tornado Weather Hits, These Scientists Break Out the Colored Pencils appeared first on New York Times.