For graphics journalists at The New York Times, making sense of the sprawling Middle East conflict for readers is somewhat like putting together a puzzle. Except some of the pieces are missing.
Initial government statements might be vague. A video posted on social media needs to be authenticated. But assembling these pieces, and comparing them against satellite imagery and reporting from our correspondents in the region, Times graphics journalists have been able to pinpoint targeted areas and document damage, often within hours after missiles are fired.
Some incidents, such as the strike that hit an elementary school in southern Iran, require days of reporting to understand. At other times the story emerges more quickly, such as the attack on the leadership compound in Tehran and the death of Ayatollah Ali Khamenei on the first day of the conflict.
I spoke with three visual journalists from our International and Graphics departments, Samuel Granados, Elena Shao and Lazaro Gamio, about how they cover the war in Iran.
Their answers have been edited and condensed for length and clarity.
As the war in Iran grinds through its second week, we’ve published an array of maps tracking U.S. and Israeli military strikes inside Iran, as well as Iran’s retaliation on its neighbors. How do we get reliable data?
SAMUEL GRANADOS: We seek out reporting from a range of sources. Official statements — from governments or state media — are a common starting point, but they often require more verification.
Our colleagues in the Middle East speak to witnesses who can report whether an explosion was heard or a plume of smoke was seen. We analyze satellite images to check for damage. And we can pinpoint precise locations using various tools, such as verifying videos on social media.
I imagine verifying using social media posts presents its own challenges.
ELENA SHAO: Misinformation and disinformation has long been a challenge, but the pervasiveness of A.I.-generated content — which we have seen with this current conflict — has amplified that. The verification process can take more time now, and we’ve had to leave some stuff on the cutting-room floor because it didn’t meet our standards.
A lot of it comes down to cross-referencing those sources Samuel mentioned. One data source may not be enough on its own. But can we use a report from someone on the ground to verify the time of day and rough location of a strike? Does that line up with a video we found on social media where we can see a plume of smoke coming from a specific building? Can that help us narrow in so we know where to look on the satellite imagery for damage to infrastructure?
It starts to feel very much like putting the pieces of a puzzle together until you can make out the image — and we have to use our judgment to determine whether or not that image is clear enough with the pieces we have.
GRANADOS: Indeed. I can’t count the times this week I’ve asked colleagues to take a look at things, just to have more eyes on something.
How quickly after a strike occurs can we pinpoint it?
GRANADOS: It can vary a lot depending on several factors, such as available sources, accessibility, whether the event occurred in a more or less populated area, whether a satellite passed the area minutes before or after. That determines the amount of available imagery we can use in our reporting. In some cases, this can be done immediately. In other cases, we must wait until good satellite imagery is available, which can take hours or even days.
Tell me more about how we use satellite imagery. Where do these images come from? How do we zero in on the right place?
GRANADOS: We get satellite images from different commercial providers. The process of pinpointing a specific place is usually iterative and involves coordination and a team effort.
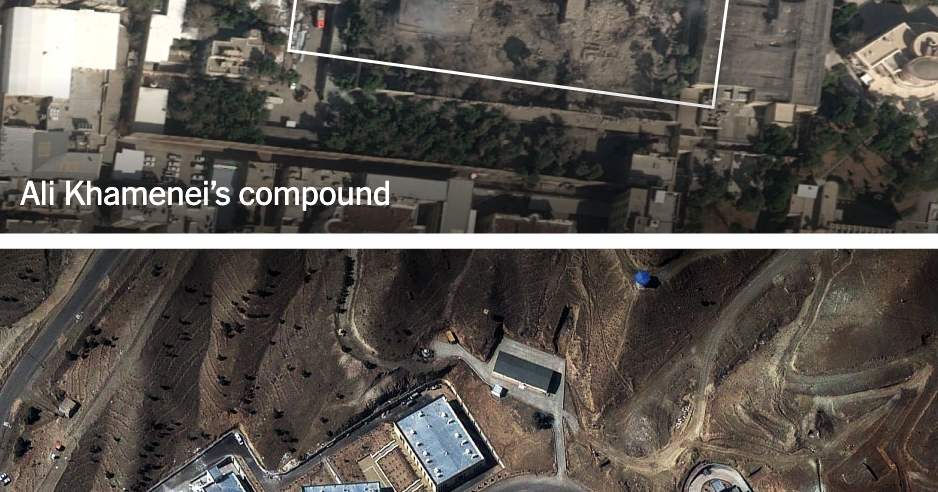
In the early hours of the first U.S.-Israeli attacks, for example, we knew from our colleagues in the Middle East that Tehran had been attacked, but there wasn’t much information about the precise locations. Christiaan Triebert, a reporter on our Visual Investigations team, had already identified the location of three videos of the area surrounding Ali Khamenei’s compound, which suggested that it had been attacked.
Minutes later, Josh Holder, a graphics reporter in London, managed to obtain a high-resolution satellite image of the destroyed compound and posted it on our live blog — what may have been the first published image of the damage. The whole process was very quick, taking about two hours.
How do we bring together the expertise needed to interpret these images?
GRANADOS: This process involves talking to other colleagues in our newsroom, as well as scholars and outside experts. Our international correspondents are often key to understanding whether a target holds particular significance. In the case of the Iranian leadership compound, previous reporting by our colleague Farnaz Fassihi proved very useful in immediately determining the facility’s importance.
Do we worry about compromising U.S. military security?
GRANADOS: This is a real concern, and we carefully assess the timing and specificity of our reporting on military positions. On maps showing the U.S. military deployment near Venezuela, we represented the position of ships without showing their exact locations. We’re using a similar approach in the conflict with Iran. These maps are usually zoomed out at a regional level, and their main goal is to give a sense of scale, rather than being precise about locations.
Satellite imagery is another way of conveying the scale of what’s happening, and we take care to balance what’s important for the public to understand about the war and any potential security issues around specific imagery.
This confrontation had been brewing for weeks. How had graphics reporters prepared for the moment when missiles started falling?
LAZARO GAMIO: During last summer’s conflict, when Israel and the United States targeted Iranian nuclear sites and other facilities, it was becoming hard for us to keep track of all the strikes, which led us to create a database where we could collaboratively catalog and verify strikes.
From that single source of data, my colleague Daniel Wood and I created a mapping tool to ingest the data and render maps on the fly. By the time this war started, the system was ready for the ultimate test: a rapidly evolving breaking news situation.
We’ve spent a lot of time formalizing our process for cataloging strikes and thinking through different facets of verification. We think about things like location precision: Do we know the exact street corner where this happened, or do we just know the neighborhood?
GRANADOS: In the weeks leading up to the current conflict, we also spent a lot of time talking to sources and working to understand what was coming. We investigated how Iran had been repairing sites that were destroyed in June, analyzed the potential risks of a conflict and monitored military buildup in the region. In this process, we learned a lot about the type of infrastructure that could be targeted, as well as the Iranian leadership and the structures of power that sustain the regime. So we put together a list of around 100 potential targets that turned out to be very useful in the early stages of the conflict.
How do you view your role in relation to the reporters and editors crafting text-based stories?
SHAO: When designing a map or a chart, I’m often thinking from the perspective of a reader who may be dipping in and out of our coverage. We try to provide a quick way to ingest many pieces of important information at a glance.
Sometimes visuals are a better way to convey something. Maps can give a sense of spatial scope that a number might not be able to articulate, especially for readers who are unfamiliar with the geography. Annotated images of satellite imagery can show damage with a level of specificity words can’t always provide.
GRANADOS: We’re also reporters, just with a focus on visual storytelling, so ultimately it’s about finding the balance between the elements of a piece.
Seth Carlson is an editor on the Trust team, which works to help readers understand The Times and its journalistic values.
The post How The Times Uses Graphics and Maps to Track the Mideast Conflict appeared first on New York Times.