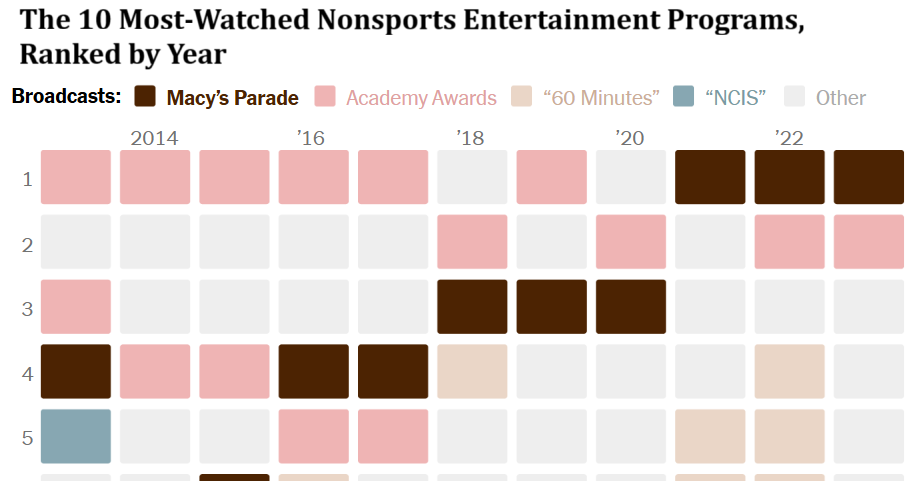
1. After looking closely at the graph above (or at this full-size image), answer these four questions:
- What do you notice?
- What do you wonder?
- How does this relate to you and your community?
- Create a catchy headline that captures the graph’s main idea.
The questions are intended to build on one another, so try to answer them in order.
2. Next, join the conversation online by clicking on the comment button and posting in the box. (Teachers of students younger than 13 are welcome to post their students’ responses.)
3. Below the response box, there is an option to click on “Email me when my comment is published.” This sends the link to your response which you can share with your teacher.
4. After you have posted, read what others have said, then respond to someone else by posting a comment. Use the “Reply” button to address that student directly.
On Wednesday, Nov. 19, teachers from our collaborator, the American Statistical Association, will facilitate this discussion from 9 a.m. to 2 p.m. Eastern time.
5. By Friday morning, Nov. 21, we will reveal more information about the graph, including a free link to the article that includes this graph, at the bottom of this post. We encourage you to post additional comments based on the article, possibly using statistical terms defined in the Stat Nuggets.
Reveal
We’ll post more information here by Friday morning. Stay tuned!
More?
• See all graphs in this series or collections of 75 of our favorite graphs, 28 graphs that teach about inequality and 24 graphs about climate change.
• View our archives that link to all past releases, organized by topic, graph type and Stat Nugget.
• Learn more about the notice and wonder teaching strategy from this 5-minute video and how and why other teachers are using this strategy from our on-demand webinar.
• Sign up for our free weekly Learning Network newsletter so you never miss a graph. Graphs are always released by the Friday before the Wednesday live moderation to give teachers time to plan ahead.
• Go to the American Statistical Association K-12 website, which includes teacher statistics resources, Census in the Schools student-generated data, professional development opportunities, and more.
Students 13 and older in the United States and Britain, and 16 and older elsewhere, are invited to comment. All comments are moderated by the Learning Network staff, but please keep in mind that once your comment is accepted, it will be made public.
The post What’s Going On in This Graph? | Nov. 19, 2025 appeared first on New York Times.